


How UAS/Drones Are Used In Geographic Information Systems (GIS)

UAS/Drone Use in Geographic Information Systems (GIS)
Ace of Drones | Oklahoma City
GIS is only as good as the data that feeds it. Maps, layers, and models look authoritative on a screen, but they go stale the moment the ground changes — new pavement, a cleared corridor, a shifted stockpile, a washed-out ditch, a rebuilt pad.

Drones close that gap. A professional UAS mission captures current conditions with position, time, and measurable geometry, then hands that data to GIS in the forms GIS actually runs on: raster data, vector data, and point cloud data.
Raster data is a grid. Every cell has a location and a value — color, elevation, temperature, or intensity. Orthomosaics, digital surface models, digital terrain models, slope rasters, and thermal grids are raster products.
Vector data is geometry with attributes. Points, lines, and polygons carry meaning: a manhole, a fence line, a pavement edge, a stockpile footprint, a damage polygon, a right-of-way centerline.
Point cloud data is a mass of individual 3D points. Each point has a position — and usually color, intensity, or classification. Photogrammetry and LiDAR both produce point clouds. GIS uses them as the 3D source behind surfaces, heights, clearances, and digital-twin context.
Geometry without meaning is only a drawing. Attribute data is the table behind the map — the fields that tell GIS what a pixel, a feature, or a point set is, when it was captured, how accurate it is, and what the organization should do with it.
On a raster, attributes live in the cell values and in the raster’s metadata: elevation in a DSM cell, temperature in a thermal cell, an index value in NDVI, plus dataset-level fields such as date, CRS, sensor, units, and accuracy.
On a vector, attributes live in the feature table: feature ID, type, condition, date, source flight, photo link, quantity, owner, and status.
On a point cloud, attributes live on the points and on the dataset: XYZ, color or intensity, classification, return number when LiDAR is used, plus file-level fields such as date, CRS, density, sensor, and accuracy.
Pictures alone are not GIS. Pictures become GIS when they are turned into a georeferenced raster that can be measured, when features are extracted into vectors that can be queried, when the site is preserved as a point cloud that can be measured in 3D, and when all three carry attributes the rest of the database can join.
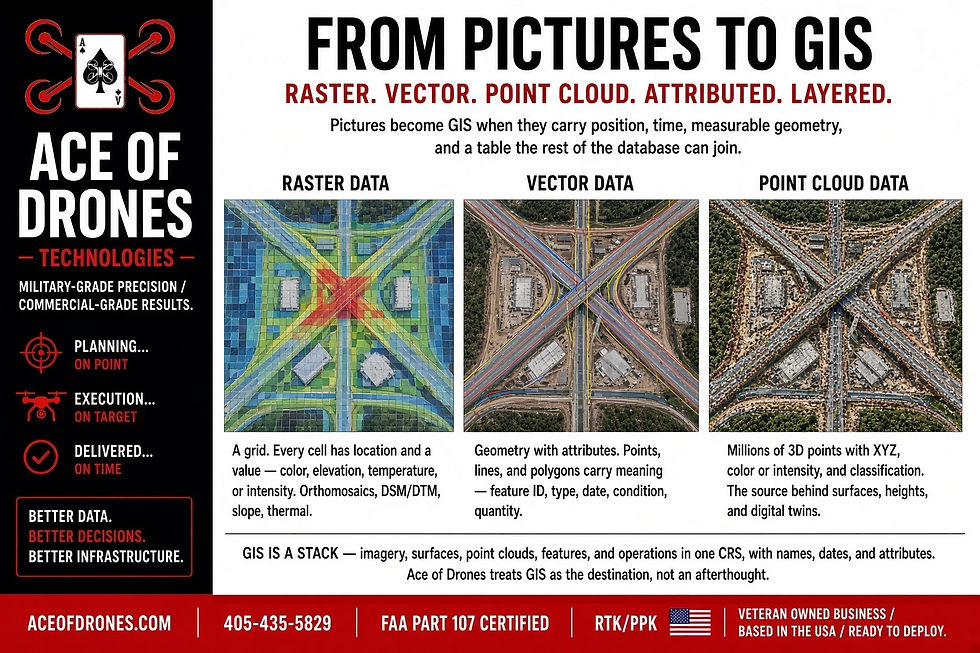
Those products only pay off when they are layered. GIS is not one map. It is a stack: imagery on the bottom, surfaces and point clouds above or beside it, features on top, and operational layers — parcels, utilities, work orders, design — sitting in the same frame. Drone data earns its keep when it drops into that stack in the right order, in the right coordinate system, with names, dates, and attributes the rest of the organization can find.
What once took survey crews days to collect can now be captured in hours, processed into rasters, vectors, and point clouds, and published as layers in the same systems planners, engineers, and asset managers already work in.
At Ace of Drones, we treat GIS as the destination, not an afterthought. Flights are planned so raster, vector, and point-cloud outputs land on the project or agency coordinate system, with the accuracy, metadata, attributes, and file structure GIS teams actually need.
This page explains how drones are used in GIS and the benefits that follow when aerial data is built as raster layers, vector layers, and point-cloud layers — not just as photos.
How Drones Are Used in GIS

GIS teams, surveyors, engineers, planners, and asset owners use drones for:
Base-map and existing-conditions capture
Georeferenced orthomosaics (raster layer with pixel values and raster attributes)
Digital surface models and digital terrain models (raster layers with elevation attributes)
Contours derived from elevation rasters (vector layer with elevation attributes)
Planimetric feature extraction (vector layers with feature attributes)
Photogrammetric and LiDAR point clouds (LAS/LAZ or agreed format)
GIS layer stacks for planning, inspection, and operations
Corridor and right-of-way mapping
Change detection between dated rasters and point clouds
Stockpile, cut-and-fill, and volumetric layers
Vegetation and encroachment mapping
Storm, flood, and post-event condition layers
Textured mesh and 3D GIS / digital-twin context
Ground-control and RTK/PPK-supported positioning
CAD, BIM, and asset-management handoff
High-resolution imagery, orthomosaics, LiDAR and photogrammetric point clouds, and elevation models give GIS a current, measurable picture of the ground. The raster becomes the visual and surface base. The point cloud becomes the 3D source. The vectors become the features the organization can count, filter, and maintain. Attributes make those layers searchable. Layering is what lets those products work together instead of living in separate folders.
Raster Data From Drone Missions
Raster is the foundation of most drone-to-GIS workflows. The aircraft collects overlapping images or LiDAR returns. Processing turns that capture into continuous grids that sit in GIS like any other imagery or surface layer.

Common raster deliverables
Orthomosaic — a corrected image map; each pixel has a real-world location and color
DSM — elevation of the visible surface, including structures and canopy
DTM — bare-earth or design-oriented terrain where the sensor and processing support it
Hillshade, slope, and aspect — derived rasters for review and analysis
Thermal raster — temperature values when infrared is scoped
Multispectral indices — NDVI and related grids when agriculture or vegetation analysis is in scope
Why raster matters in GIS
It is the current picture of the site, not last year’s aerial
Distances, areas, and alignments can be measured on a georeferenced orthomosaic
Elevation rasters drive contours, volumes, drainage, and flood screens
Two rasters from different dates support change detection
Rasters sit at the bottom of the layer stack so vectors have visual context
A raw photo folder is not a raster GIS layer. A georeferenced GeoTIFF with a defined coordinate system is.
Attribute Data on Raster Layers
A raster is more than a picture. Each cell holds a value, and the dataset as a whole should carry attributes GIS can trust.

Cell-level attributes (the value in the grid)
Color / band values in an orthomosaic
Elevation in a DSM or DTM
Slope or aspect in a derived surface
Temperature in a thermal raster
Index values such as NDVI
Those values are what GIS measures, samples, and reclassifies. Without documented units, a “47” in a cell is meaningless.
Dataset-level attributes (the table and metadata behind the raster)
Site or asset name
Capture date and time
Sensor and aircraft
Coordinate system and units
Cell size / resolution
Vertical datum when elevation is included
Accuracy notes (RTK/PPK, RMSE, control used)
Flight or work-order ID
Processing software and product version
Intended use (planning exhibit vs. quantity-grade surface)
Why raster attributes matter
Two orthomosaics can be compared only if dates and CRS are stored
Volume and contour work require units and a vertical datum
Thermal and index rasters are unusable without value meaning
Asset systems need a date and source to archive the layer
Future staff can reload the raster without guessing what it is
Ace of Drones delivers rasters with the cell values the analysis needs and the dataset attributes the GIS catalog needs.
Vector Data From Drone Missions
Vector is how GIS stores meaning. After the raster and point cloud exist, features can be digitized, extracted, or derived and stored as points, lines, and polygons with attributes.
Common vector deliverables
Points — utilities, trees, signs, control, damage locations, photo markers
Lines — centerlines, fence lines, drainage, pavement edges, alignments, stationing
Polygons — building footprints, pavement, stockpiles, inundation, disturbance, parcels of work
Contours — elevation vectors derived from the DSM, DTM, or point cloud
Encroachment and vegetation polygons along a corridor
Inspection and punch-list features tied to a date and photo
Why vector matters in GIS
Vectors can be selected, filtered, and joined to asset tables
Attributes travel with the geometry: type, condition, date, quantity, photo ID
Work orders, inspections, and inventories run on vectors, not pixels
Design, CAD, and BIM handoff is cleaner when features are already geometry
Change can be stored as new feature classes instead of only as a new picture
The strongest programs deliver a current raster base, a point cloud for 3D measurement, and a vector feature set the GIS can keep alive after the flight.
Attribute Data on Vector Layers
A vector without a table is just a shape. The attribute table is what turns a polygon into a stockpile, a line into a fence, and a point into an inspection finding.

Core attributes every drone-derived vector should carry
Unique feature ID
Feature type / class
Capture date
Source flight or project ID
Source raster or point-cloud name
Coordinate system / units (when not inherited from the dataset)
Photo or report link
Created-by / method (digitized, extracted, derived)
Operational attributes GIS teams actually query
Condition or status
Owner or responsible party
Quantity, area, length, or volume
Elevation or height when relevant
Encroachment type
Damage type and severity
Priority or action item
Inspection notes
Related asset ID so the feature can join the existing inventory
Examples
A stockpile polygon is useful when it includes material, date, and volume — not just an outline
A damage point is useful when it includes type, severity, photo, and priority
A contour is useful when the elevation attribute is populated and the units are stated
A photo-marker point is useful when it links to the image and the flight date
Why vector attributes matter
Maps can be filtered: show only high-priority damage, only this week’s change, only one corridor
Features can join work-order, parcel, and asset tables
Exhibits and reports can be generated from the table instead of rebuilt by hand
History stays attached to the feature when the next flight lands
Ace of Drones does not treat attributes as optional labeling. If a vector is in the delivery, it should be queryable.
Point Cloud Data From Drone Missions
A point cloud is the 3D record of the site. Photogrammetry builds it from overlapping images. LiDAR builds it from laser returns. GIS uses it when height, clearance, density, or a true three-dimensional surface matters more than a flat picture.

Common point-cloud deliverables
Photogrammetric point cloud (colorized XYZ from imagery)
LiDAR point cloud (XYZ plus intensity and classification where processed)
LAS / LAZ or the client’s agreed 3D format
Classified cloud when scoped (ground, vegetation, buildings, noise, overhead features)
Cropped or tiled clouds for large corridors and plants
Source cloud used to derive DSM, DTM, contours, and mesh
Why point clouds matter in GIS
They preserve 3D structure that a 2D orthomosaic flattens
Heights, clearances, and profiles can be measured directly
Ground can be separated from vegetation and structures when the cloud is classified
Volumes and earthwork have a denser source than a single surface raster
Digital twins, clash checks, and inspection planning start from the cloud
Later rasters and vectors can be rebuilt or refined without flying again
A screenshot of a 3D model is not a point-cloud deliverable. A georeferenced LAS/LAZ with known CRS, density, and attributes is.
Attribute Data on Point Clouds
Point clouds carry attributes at two levels: on each point, and on the file.

Point-level attributes
X, Y, Z position
RGB color from imagery, when photogrammetry is used
Intensity, when LiDAR is used
Classification (ground, vegetation, building, wire, noise, unclassified)
Return number and number of returns, when LiDAR is used
GPS time or scan identifiers, when the sensor provides them
Dataset-level attributes
Site or asset name
Capture date and time
Sensor and aircraft (photogrammetry vs. LiDAR)
Coordinate system, units, and vertical datum
Nominal point density / spacing
Accuracy notes (RTK/PPK, RMSE, control used)
Flight or work-order ID
Classification schema, if classified
Processing software and product version
Intended use (visualization vs. quantity-grade measurement)
Why point-cloud attributes matter
Classification is what lets GIS extract ground versus canopy
Density and accuracy tell an engineer whether the cloud supports design or only context
Date and source let the next flight become change detection instead of a one-off model
CRS and datum keep the cloud in the same stack as the orthomosaic and vectors
If the cloud is in the delivery, it should load into GIS or 3D software with those fields intact — not as an anonymous pile of dots.
GIS Layering: How Drone Data Is Stacked
Layering is the working method of GIS. Each layer answers one question. The map becomes useful when those answers occupy the same space, and each layer carries the attributes that explain it.

A typical drone-informed stack looks like this, from the ground up:
Reference and control — project CRS, ground control, check shots, agency basemap
Image raster — current orthomosaic, with date, resolution, and CRS attributes
Point cloud — photogrammetric or LiDAR cloud, with density, classification, and accuracy attributes
Surface rasters — DSM, DTM, slope, hillshade, thermal or index rasters when scoped, often derived from the cloud, with value units and vertical datum
Derived vectors — contours and breaklines, with elevation attributes
Extracted site vectors — pavement, buildings, drainage, fences, stockpiles, equipment pads, with type and quantity attributes
Operational layers already in the GIS — parcels, utilities, ROW, work orders, design, assets
Analysis layers — change polygons, encroachment, inundation, punch-list points, with status and priority attributes
Annotation and reporting — labels driven by the attribute table, photo links, date stamps, exhibit layouts
That order matters.
If the orthomosaic is not georeferenced, every layer drawn on it is in the wrong place.
If the point cloud, DSM, and orthomosaic do not share a coordinate system, contours and clearances will not sit on the image.
If feature vectors are delivered without attributes or a date, they cannot join the asset database.
If the point cloud has no classification or metadata, GIS cannot extract ground or defend a measurement.
If change is only a new picture and not a new layer with attributes, last month’s work disappears under this month’s pixels.
Layering rules that keep drone data usable
One coordinate system for the whole stack
Clear layer names with site, product, and date
Rasters for continuous surfaces and pictures
Point clouds for 3D measurement and classification
Vectors for features that must be queried
Attributes on every layer that will be searched or joined
Separate layers for separate themes — do not dump pavement, damage, and utilities into one file
Visibility and scale so a corridor map does not turn into noise
A published group layer or map package so the client opens one stack, not twenty loose files
Ace of Drones plans capture and delivery around that stack. The flight is not finished when the aircraft lands. It is finished when the layers land in GIS in an order a project manager can turn on and off, with attributes a GIS analyst can query.
Core Benefits of Drones in GIS

Faster map updates with fewer field hours
A single planned flight can cover a site, plant, corridor, or neighborhood that would take a ground crew days to photograph coherently. Faster capture cycles reduce the lag between what is on the ground and what is in the GIS — the raster base, the point cloud, and the vectors drawn from both.
Better positional integrity
Pretty pictures are not GIS. Ace of Drones uses multi-band GNSS with RTK and PPK correction so rasters, vectors, and point clouds can be tied to project or agency control. That is what makes measurements, overlays, and change detection defensible.
Richer layers from one mission
The same flight can produce an orthomosaic raster, a point cloud, DSM/DTM rasters, contours as vectors, and extracted planimetrics. GIS gets a stack of related layers instead of a folder of unlabeled photos.
Attributes that make the map a database
Cell values, point attributes, metadata, and feature tables turn the stack into something the organization can filter, join, and report. That is the difference between a poster and a GIS.
A stack the organization can actually run
Layering lets engineering look at surfaces and clouds, operations look at assets, and leadership look at change — from the same flight, without rebuilding the map.
Safer collection in hard-to-reach areas
Corridors, slopes, live construction, roofs, towers, flooded ground, and active yards can be documented without putting people on every surface first.
Repeatable history
The same flight plan, flown again later, creates a dated raster and point-cloud record. Vectors can then mark what changed. Attributes keep the date, source, and status attached. GIS holds a timeline of layers, not just a snapshot.
Base Maps and Existing Conditions
Every useful GIS project starts with a current base. That base is almost always a raster orthomosaic, with a point cloud available for 3D context and vectors drawn on top.

Drone orthomosaics give planners and engineers a seamless, georeferenced image of the site as it exists today — not last year’s aerial, not a satellite scene that misses the latest earthwork.
Typical uses:
Pre-design existing-conditions maps
Permit and public-hearing exhibits
Field-to-office orientation for crews who have not walked the whole site
Background rasters under utilities, parcels, and design vectors
The orthomosaic is Layer 1 of the working 2D stack. The point cloud is the 3D companion. Attributes — date, resolution, density, CRS — tell every later layer what it is sitting on.
Orthomosaics, Measurement, and Planimetrics
An orthomosaic is a corrected raster image map. Distances, areas, and alignments can be measured on it because each pixel is tied to ground position.

From that raster and from the point cloud, GIS teams extract vectors to:
Digitize pavement, buildings, fences, drainage, and equipment pads
Inventory features along a corridor
Check encroachments and clearances
Support quantity takeoffs when paired with elevation rasters or the source cloud
Those vectors become their own layers, each with a table. Pavement does not belong in the same file as damage points. Layering keeps each theme editable, symbolized, and shareable on its own. Attributes keep each feature identifiable after the meeting ends.
The value is not the picture. The value is a measurable raster, a measurable point cloud, and vector layers that can sit next to parcels, as-builts, and design.
Elevation Models, Contours, and Terrain
Overlapping aerial imagery — processed photogrammetrically, or LiDAR where vegetation or low texture requires it — produces surfaces, not just pictures. The usual path is point cloud first, raster surface second, contour vectors third.

Point-cloud source
Photogrammetric cloud for open, textured surfaces
LiDAR cloud where vegetation, wires, or weak image texture require it
Raster layers
DSM for visible surface including structures and canopy
DTM for bare-earth or design-grade terrain where the sensor and processing support it
Slope and aspect derivatives
Vector layers derived from those rasters or from the cloud
Contours for grading, drainage, and flood review
Breaklines where scoped
Flood or inundation polygons when a water-surface elevation is applied
Raster attributes here are elevation units, vertical datum, and cell size. Point-cloud attributes here are density, classification, and accuracy. Vector attributes here are contour elevation, polygon area, and the source surface or cloud name. In the stack, the image raster shows what is there. The point cloud and elevation raster explain the shape. The contour and polygon layers make that shape usable in exhibits and design.
Point Clouds, 3D GIS, and Digital Context
Photogrammetry converts overlapping images into a dense point cloud: millions of points with position and color. LiDAR adds capability in vegetated corridors, slopes, and surfaces where image matching is weak.

From the cloud, GIS can publish:
Raster surfaces (DSM/DTM) with elevation attributes
Vector footprints and height attributes
3D features for visualization, clearance, and digital-twin context
The cloud itself as a 3D layer in capable GIS and CAD systems
Those products still layer. The cloud supports the surface. The surface supports the contours. The contours and footprints sit on the orthomosaic with the rest of the map, each carrying the attributes needed to query height, date, and source.
Change Detection and Asset History
One of the strongest GIS uses of UAS is not a single flight. It is the second, fifth, and tenth capture of the same place.

Repeatable missions let GIS:
Add a new orthomosaic layer without deleting the last one
Compare dated rasters and point clouds for earthwork and construction progress
Store change as vector polygons — new disturbance, vegetation, encroachment, debris — with date, type, and area attributes
Document storm damage against a known baseline raster and cloud
Build a dated visual, elevation, and 3D archive for claims, funding, and maintenance
Layering is what makes history possible. Attributes are what make history searchable. Keep the old raster and cloud. Add the new raster and cloud. Put a change-vector layer between them. A folder of unlabeled stills is not a GIS deliverable. A dated, attributed stack is.
Corridors, Utilities, and Linear Assets
Infrastructure and utilities are linear. Highways, rail, pipelines, transmission-adjacent public ROW, drainage channels, and fiber routes stretch farther than a ground crew can document in one shift.
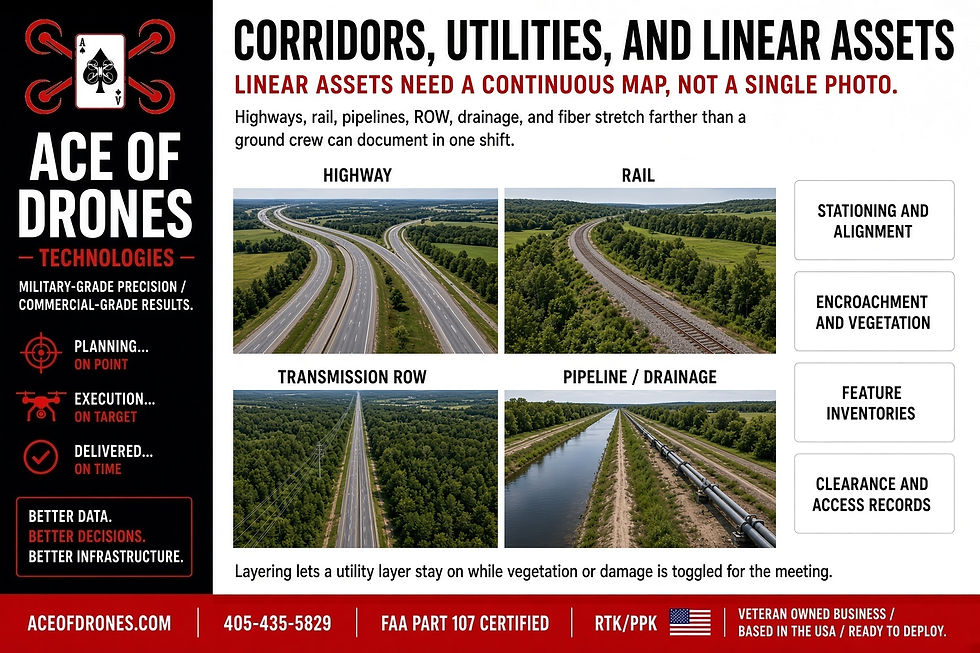
UAS corridor mapping produces continuous orthomosaic rasters, elevation rasters, and point clouds along the alignment. GIS then holds vector layers for:
Stationing and alignment
Encroachment and vegetation
Feature inventories
Clearance and access records
The raster shows the corridor. The point cloud holds the 3D structure — including vegetation and overhead features LiDAR can separate. The vectors make the corridor searchable. Attributes — owner, type, station, clearance, date — make the corridor reportable. Layering lets a utility layer stay on while vegetation or damage is toggled for a specific meeting.
Emergency, Storm, and Condition Layers
Oklahoma lives with ice, wind, flood, hail, and tornado. After an event, agencies need extent, access, and priority — not a perfect map on day ten.

Rapid aerial capture gives GIS:
A current condition raster with date and source attributes
A point cloud when 3D debris, washouts, or structural displacement must be measured
Vector polygons for damage extent, debris, inundation, and blocked access, with type, severity, and priority attributes
Timestamped layers for response, funding, and later reconstruction
Those event layers should sit on the pre-event stack, not replace it. That is how extent and priority are decided against a known baseline.
RTK/PPK and Putting Data on the Map
GIS data has to land on the agency’s map, not on a pretty picture in an undefined coordinate system. That requirement applies to rasters, vectors, and point clouds equally. If the orthomosaic or cloud is in the wrong place, every layer drawn from it is in the wrong place. If the attributes do not record CRS, datum, and accuracy, later users cannot defend the layer.

Ace of Drones uses multi-band GNSS with RTK and PPK correction so deliverables can be tied to project or agency control. High positional accuracy is what makes volumes, clearances, alignments, and change detection defensible.
When control is required, we plan ground control and check shots with the GIS or survey lead so raster, vector, and point-cloud products match the system of record and stack cleanly with layers the client already owns.
Data That GIS Can Actually Use
A professional GIS-ready package should include raster, vector, and point-cloud products, organized as layers, with attributes on each.

Common raster deliverables
Georeferenced orthomosaic (GeoTIFF or agreed format)
DSM / DTM
Optional thermal or index rasters
Pyramids or tiles if the client’s GIS needs them
Raster attributes: date, sensor, CRS, units, cell size, vertical datum, accuracy, flight ID
Common vector deliverables
Contours
Planimetrics or agreed feature classes
Photo-location points
Optional damage, stockpile, or encroachment polygons
Vector attributes: ID, type, date, source, photo link, quantity, condition, priority, related asset ID
Common point-cloud deliverables
Photogrammetric point cloud and/or LiDAR point cloud
LAS / LAZ or agreed 3D format
Classified cloud when scoped
Tiled or clipped clouds for large sites and corridors
Point-cloud attributes: XYZ, color or intensity, classification, density, CRS, vertical datum, date, sensor, accuracy, flight ID
Layer package
Consistent CRS and units across raster, vector, and point cloud
Layer names with site, product, and date
Metadata and attribute schema documented
Group layer or map package when the client wants one open-and-go stack
Contracts should state accepted file formats, accuracy expectations, required attribute fields, storage and access, and who may use the data downstream. Defined data governance keeps project records consistent across GIS, CAD, BIM, and cost tools.
Bringing Drone Data into a Unified GIS
Drone programs deliver measurable value when outputs connect to the system of record. Aerial intelligence gains impact when rasters update the map, point clouds update the 3D record, vectors update the inventory, attributes update the tables, and all of it sits in one layered project.

In mature environments, drone layers inform:
Capital planning
Maintenance work orders
Construction progress and earned value
Inspection history
Executive reporting without manual photo wrangling
Ace of Drones designs flights so the raster is ready to load, the point cloud is ready to measure, the vectors are ready to join, the attributes are ready to query, and the stack is ready to turn on — not so your GIS staff has to rebuild the project from raw photos.
Why Partner with Ace of Drones

Local Oklahoma City-based team with GIS and field mapping experience
Advanced RTK/PPK-capable aircraft and multi-sensor payloads
Full regulatory compliance and airspace management
Clear, GIS-ready raster, vector, and point-cloud layers with usable attributes — not a dump of raw photos
Flexible service model — no need to hire and maintain internal drone staff
Drones give GIS teams faster raster updates, measurable point clouds, cleaner vector inventories, attributed tables, a usable layer stack, stronger positional control, richer 3D context, and a repeatable record of change. Ace of Drones makes that capability available without the overhead of building an in-house program.

Ready to put current aerial data into your GIS? Contact Ace of Drones to discuss base mapping, orthomosaics, elevation rasters, point clouds, vector feature extraction, attribute schemas, GIS layering, corridor mapping, change detection, or GIS-ready 3D deliverables.


Comments